Reports
Learn how to use the Reports feature to view detailed analytics of your GroWrk activity.
This feature only includes data from January 2024 onward, regardless of your company's account activity prior to this date.
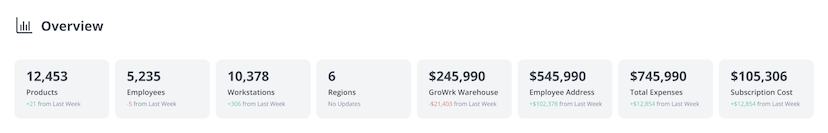
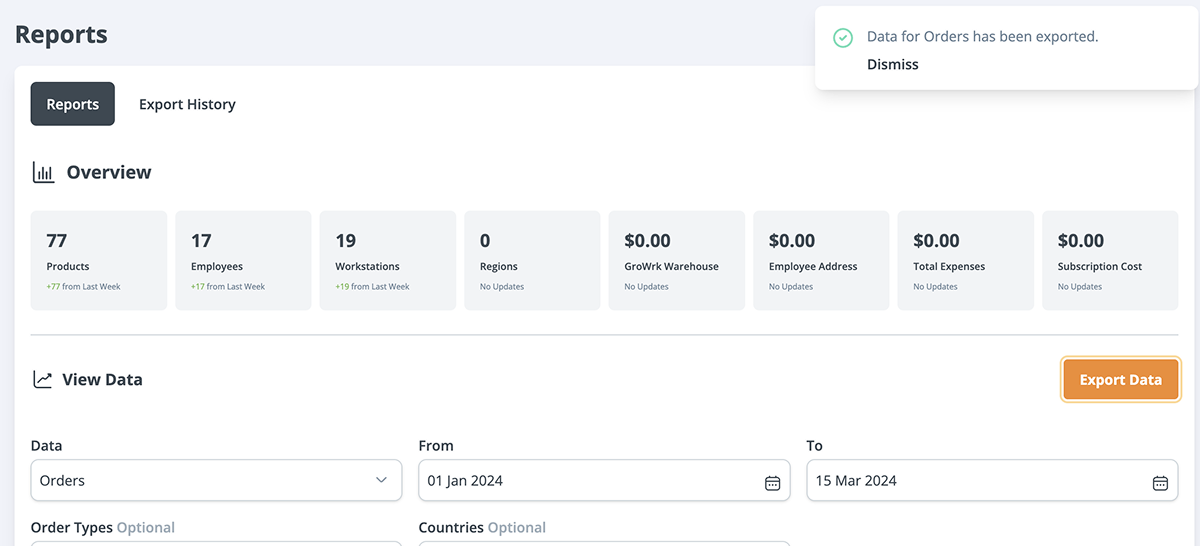
Overview
The overview section displays the following information:
- Number of products
- Number of employees
- Number of workstations
- Number of regions
- GroWrk Warehouse: Total value of inventory currently stored at a GroWrk warehouse
- Employee Address: Total value of inventory currently assigned to employees
- Total expenses
- Total subscription cost
The data presented in the overview is updated daily to reflect up-to-date analytics.
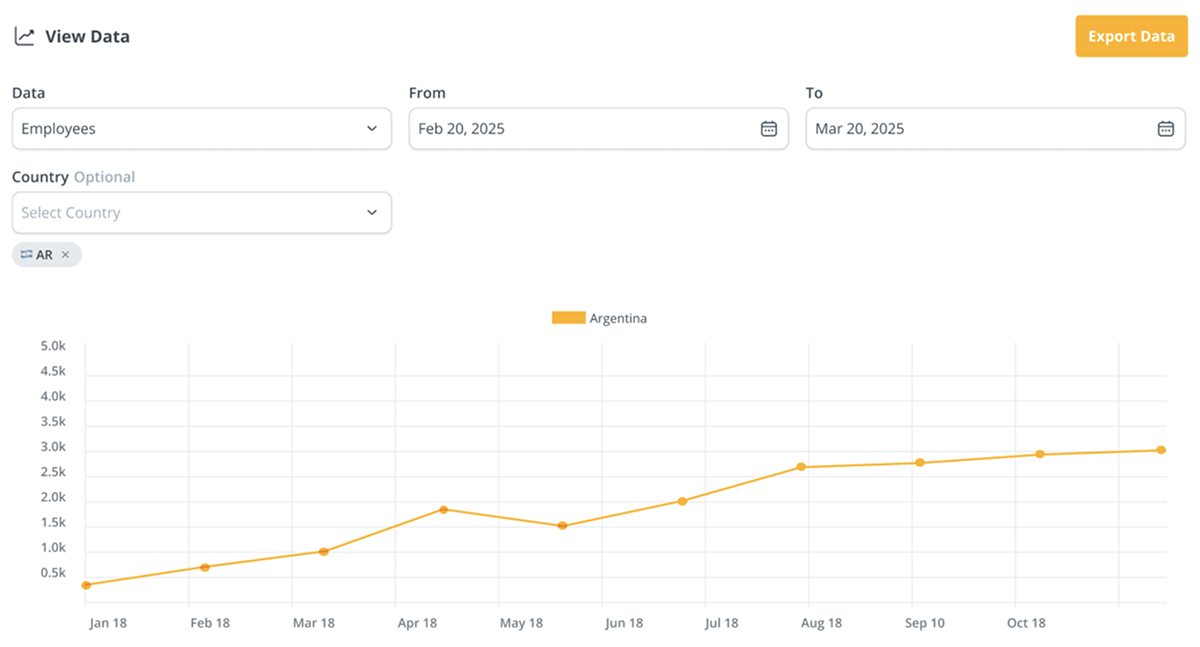
View Data
Use the dropdown to select a data type and apply filters to refine your results. Available data types include:
- Employees
- Expenses
- Order types
- Products
- Workstations
Depending on which data type you select, filters are available to refine your results.
Employees
This data type displays the number of employees within your company during a specified time frame. Country is available as an optional filter.
- Select Employees, then select a timeframe to filter the data.
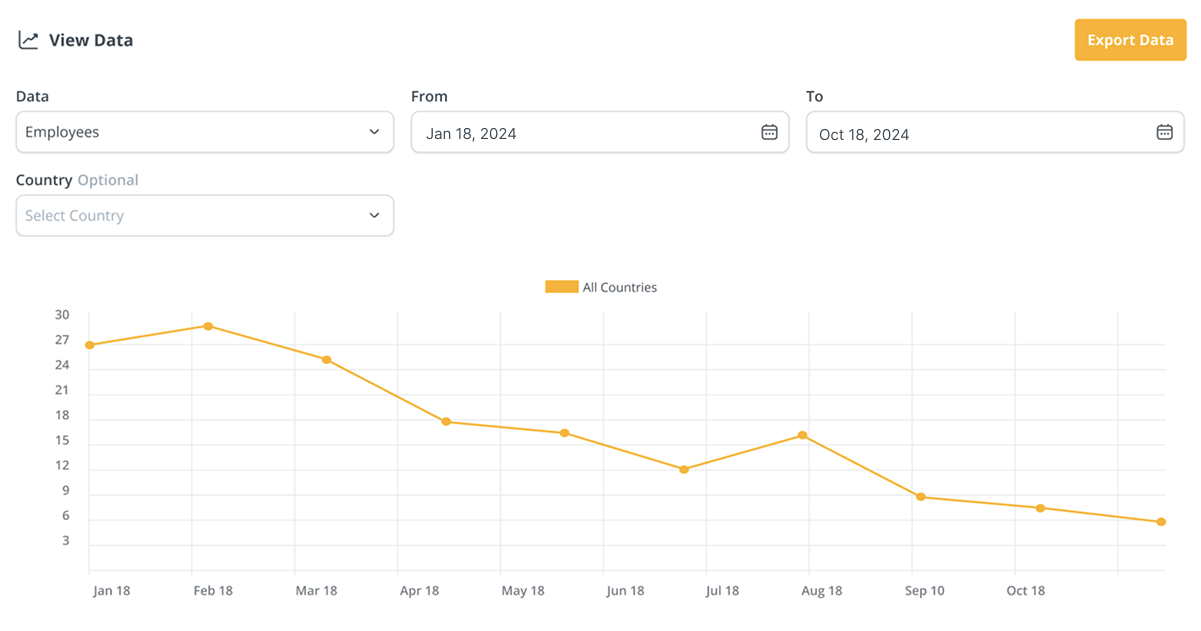
- Use the Country filter to refine your results by country.
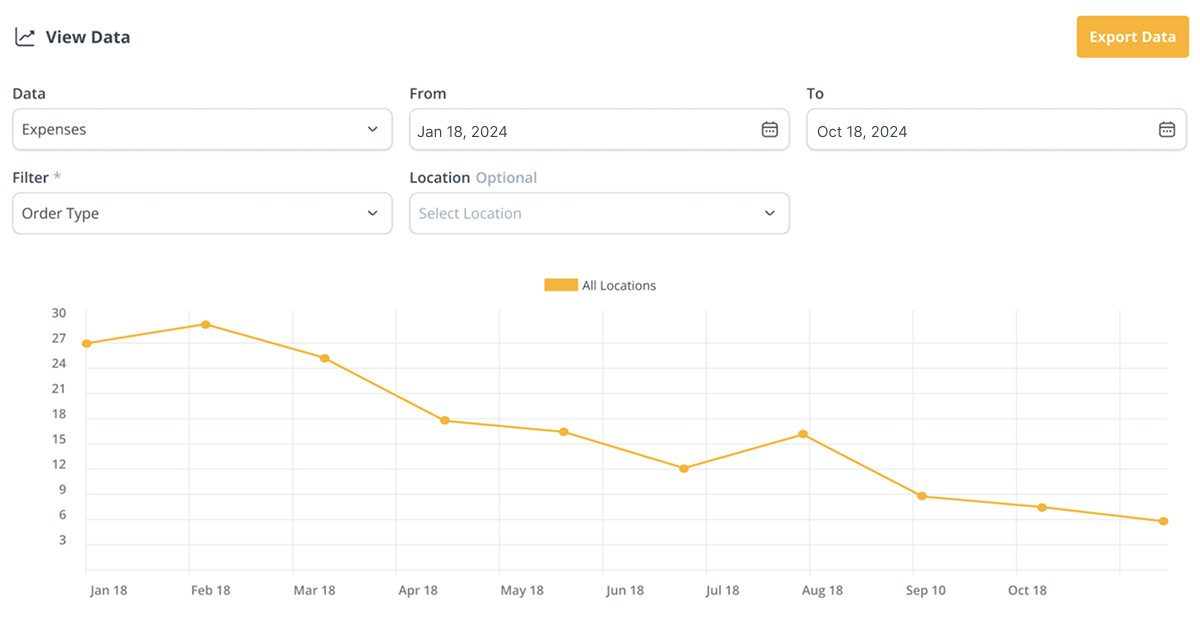
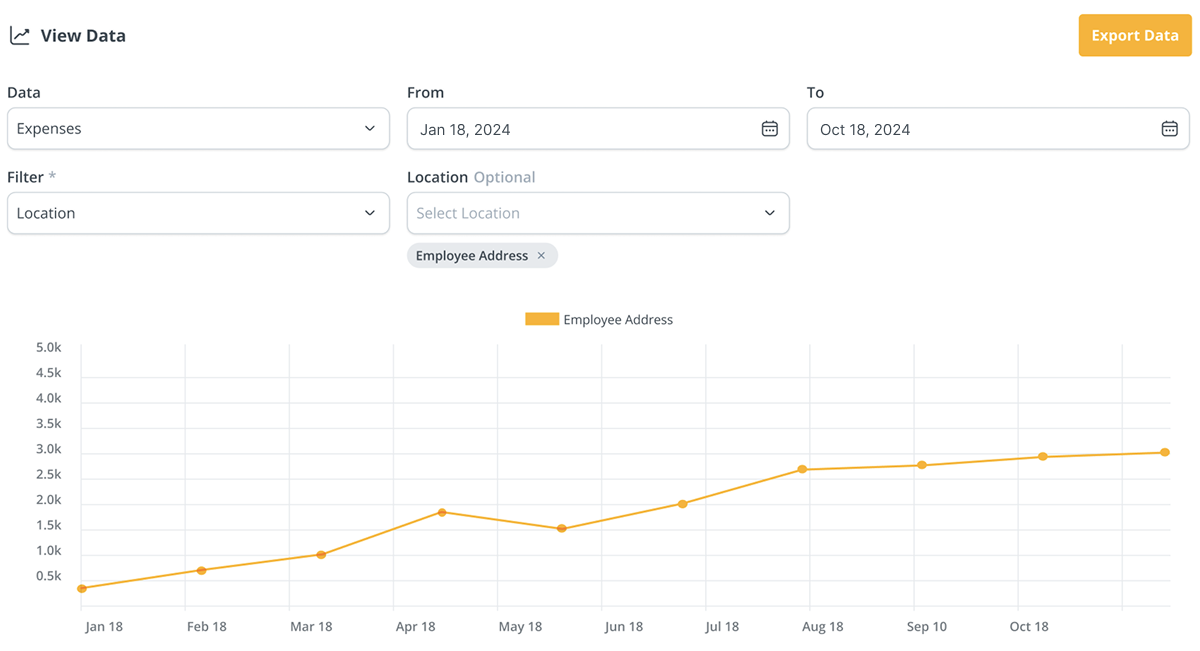
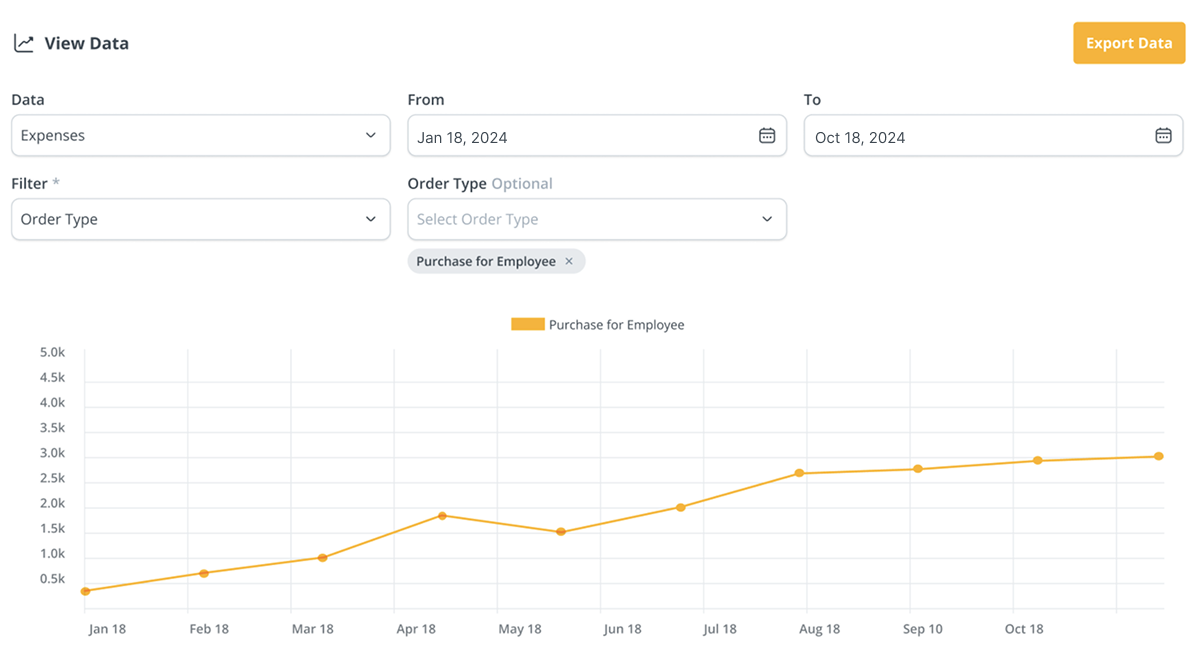
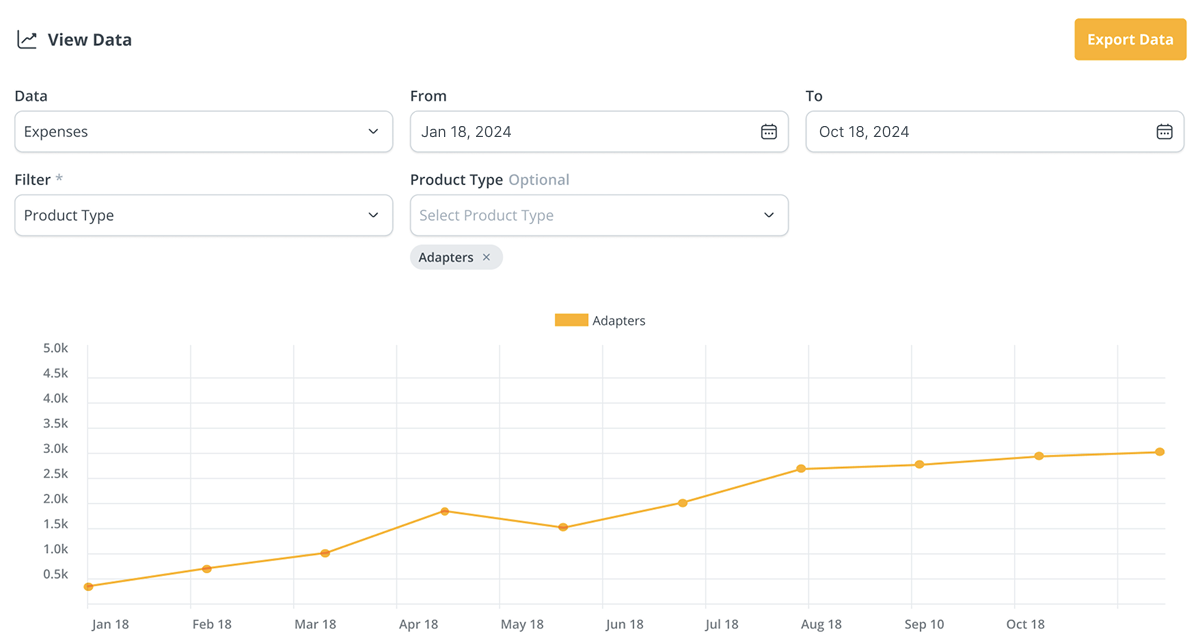
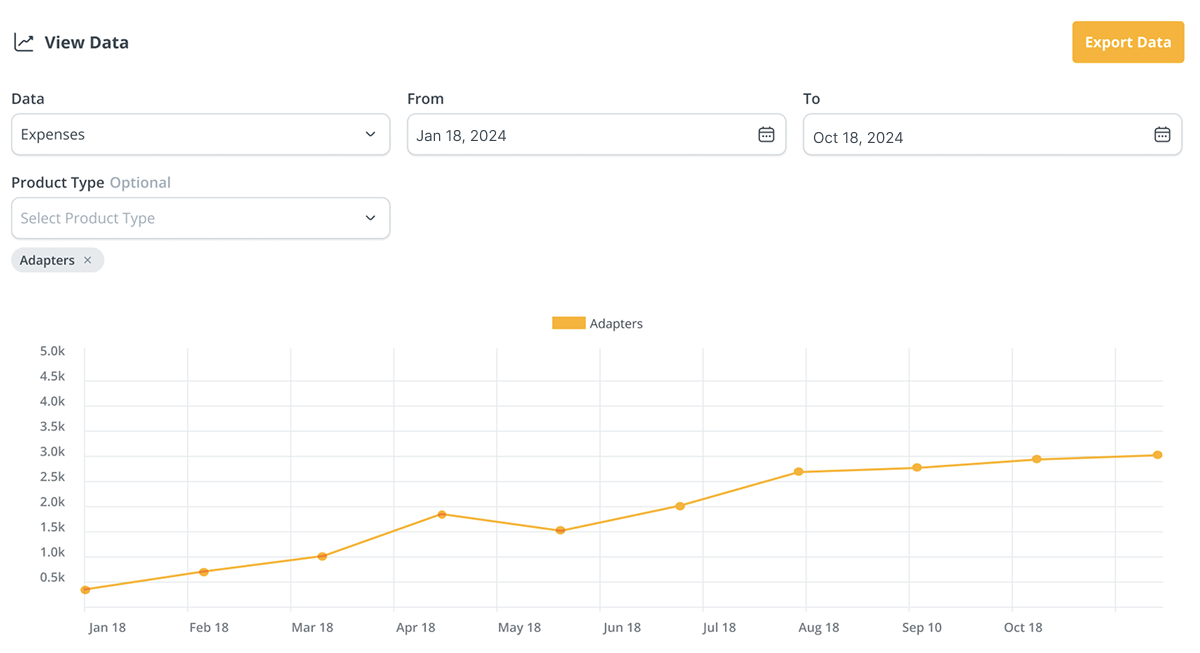
Expenses
This data type displays your company’s expenses. Location, Order Type, and Product Type are available as optional filters.
- Select Expenses, then select a timeframe to filter the data.
- Use the Location filter to refine your results by Employee Address or GroWrk warehouse.
- Use the Order Type filter to refine your results by one or more order types.
- Use the Product Type filter to refine your results by one or more product types.
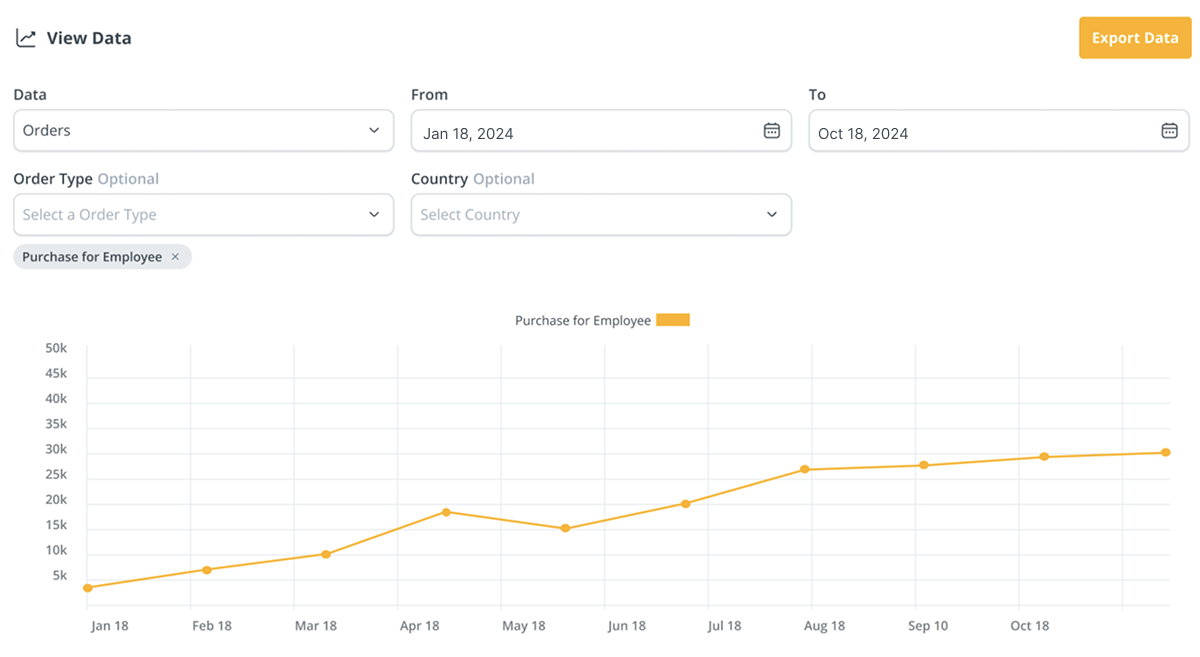
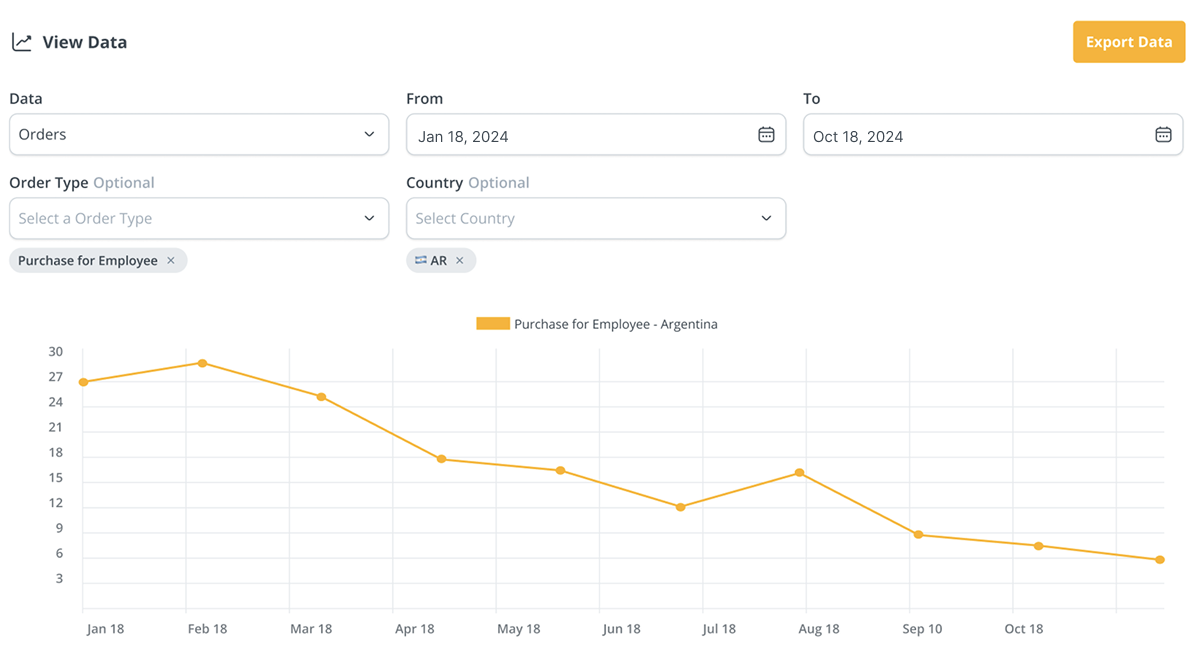
Orders
This data type displays the number of orders placed based on order type. Order types include:
- Assign to Employee
- Collection
- Maintenance
- Offboarding
- Purchase for Employee
- Purchase for Inventory
- Swap by Assigning
- Swap by Purchasing
- Import Inventory (Self-Delivery)
- Import Inventory (with Recovery)
Order Type and Country are available as optional filters.
- Select Orders, and select a timeframe to filter the data.
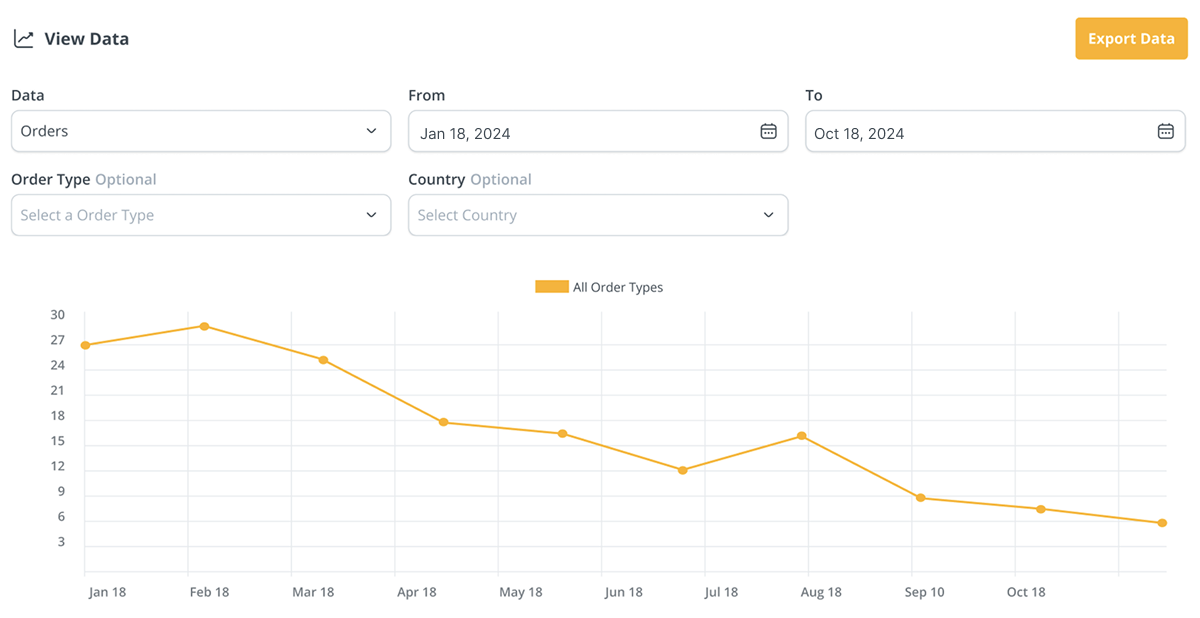
- Use the Order Type filter to refine your results by one or more order types.
- Use the Country filter to refine your results by one or more countries.
Products
This data type displays the number of products your company has. Product types include:
- Accessories
- Adapters
- Cables
- Desktops
- Headsets
- Keyboards
- Laptops
- Mice
- Monitors
- Power Protection
- Webcams
Product Type is available as an optional filter.
- Select Products, and select a timeframe to filter the data.
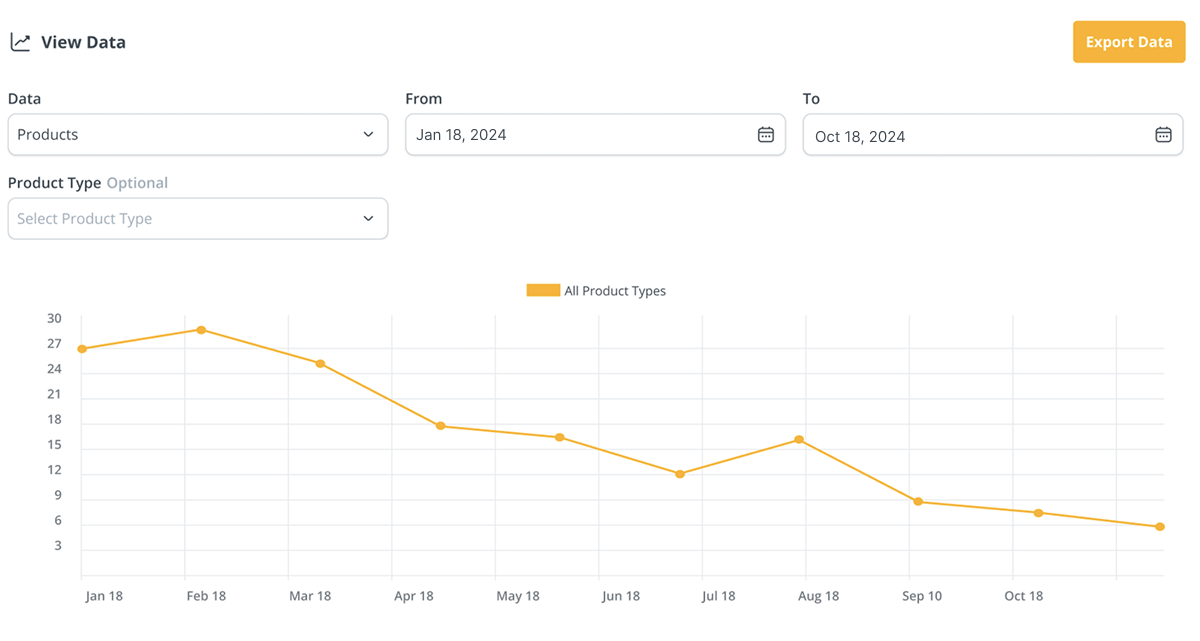
- Use the Product Type filter to refine your results by one or more product types.
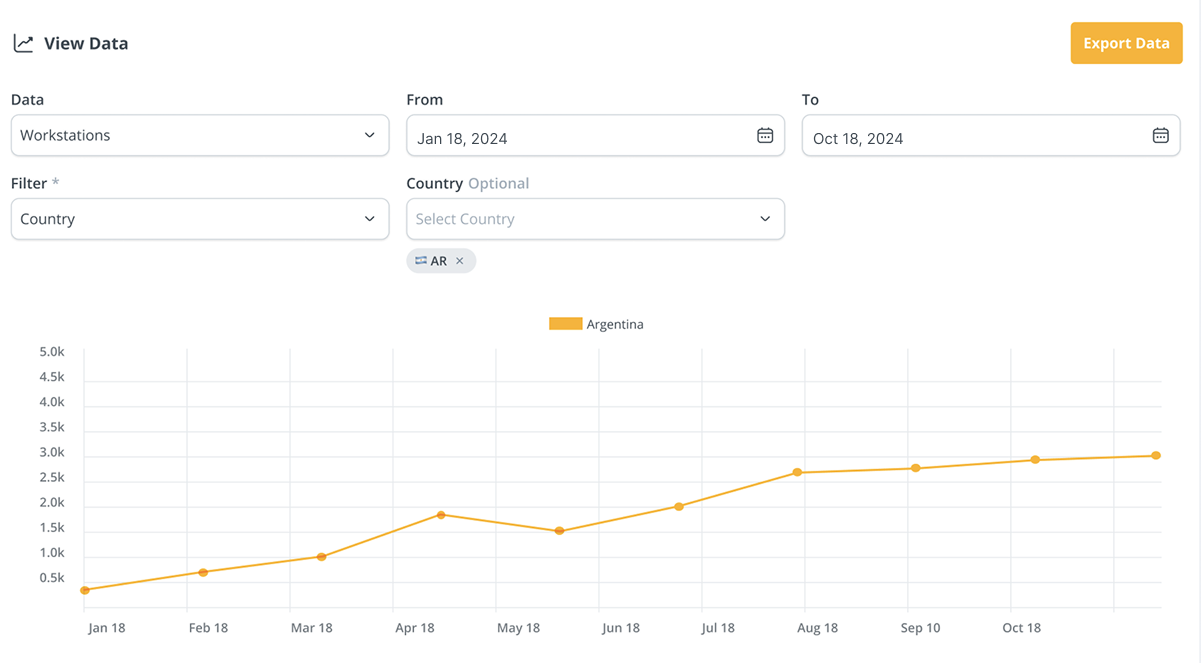
Workstations
This data type displays the number of workstations your company has. Country and Subscription are available as optional filters.
- Select Workstations, and select a timeframe to filter the data.
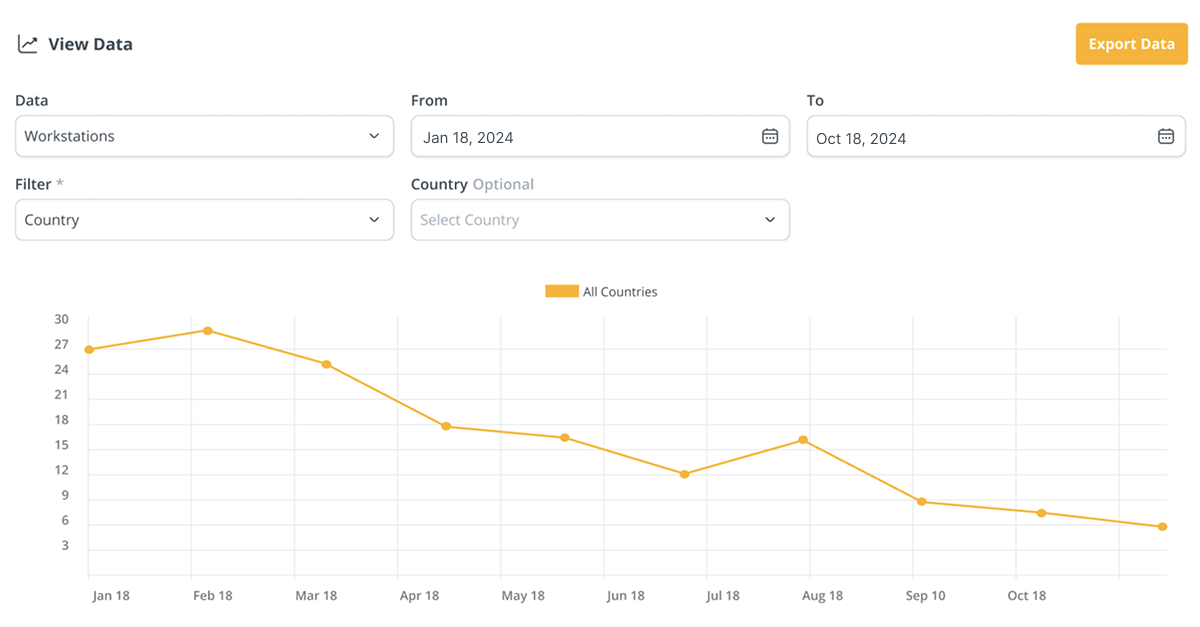
- Use the Country filter to refine your results by one or more countries.
- Use the Subscription filter to view the number of workstations under a subscription plan.

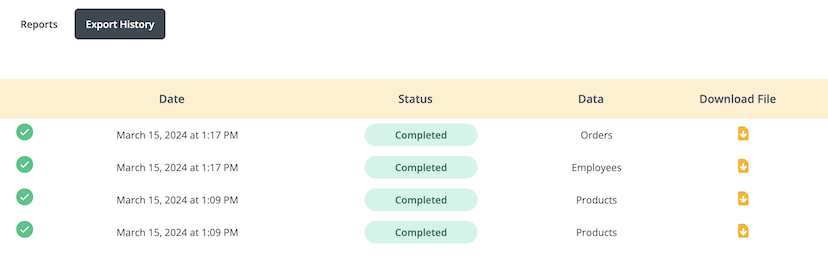
Export Data
All datasets can be exported as a CSV file.
- Select the Export Data button on the right side.
- Select the Export History tab. In the Download File column, select the download icon to save your CSV file to your device.